Francis Galton as Meteorologist
Galton was the first to identify the anticyclone (as opposed to the cyclone), and introduced the use of charts showing areas of similar air pressure - the modern weather map. His book Meteorographica (Macmillan, 1863) was the first systematic attempt to gather, chart and interpret weather data on a continental scale, a fundamental work of modern scientific meteorology. His data mapping and representation activities here, and for the Geographical society and its search for the Nile, would ultimately lead him to the statistical innovations required by his quantitative study of heredity.
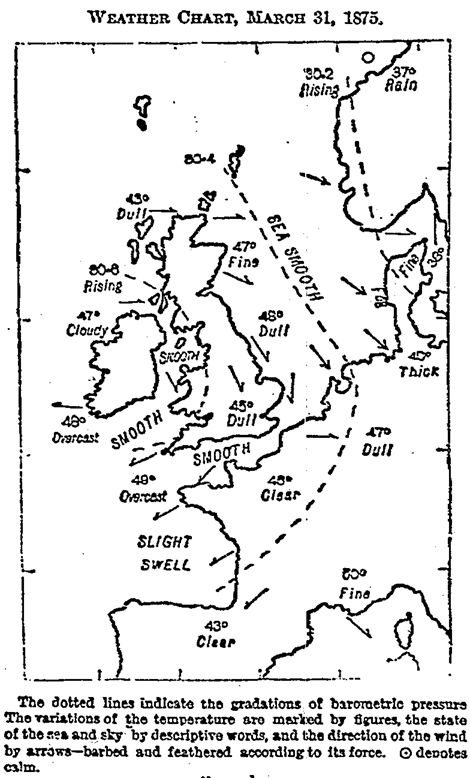
Galton prepared the first weather map published in The Times (April 1 1875, showing the weather from the previous day, March 31), now a standard feature in newspapers worldwide.
For many years he served on the Meteorological Council, in parallel with is other scientific activities. His work for the council has been badly neglected; as in other fields, he produced a steady stream of innovative ideas, proposals, and instruments - many of his devices saw extensive practical use.
| 1861 | 'Meteorological charts.' | Philosophical Magazine 22 : 34-5 | |
| 1862 | European weather charts for December 1861 | Report of the British Association for the Advancement of Science : 30 | |
| 1863 | A development of the theory of cyclones. | Proceedings of the Royal Society 12 (January 8) : 385-6 | |
| 1863 | Aristotle's Meteorology (review) | Reader, The 1 (March 21) : 289-90 | |
| 1863 | Unsigned Review of FitzRoy's The Weather Book | Athenaeum, The (1838, January 17) : 80-1 | |
| 1863 | Recent Weather | Reader, The 2 (December 19) : 730 | |
| 1866 | On an error in the usual method of obtaining meteorological statistics of the ocean. | Athenaeum, The (2027, September 1) : 274 | |
| 1866 | 'On an error in the usual method of obtaining meteorological statistics of the ocean.' | Report of the British Association for the Advancement of Science 36 : 16-7 | |
| 1866 | On the conversion of wind-charts into passage charts. | Philosophical Magazine 32 : 345-9 | |
| 1869 | Description of the pantagraph designed by Mr. Galton. | Minutes of the Meteorological Committee : 9 | |
| 1870 | 'Barometric predictions of weather.' | Nature 2 (October 20) : 501-3 | |
| 1870 | 'Barometric predictions of weather.' | Report of the British Association for the Advancement of Science 40 : 31-3 | |
| 1871 | 'Mechanical computer of vapour tension.' | Report of the Meteorological Committee : 30 | |
| 1872 | Memorandum on the Construction of 'Isodic Charts' | Minutes of the Meteorological Council (December 2) | |
| 1873 | 'On the employment of meteorological statistics in determining the best course for a ship whose sailing qualities are known.' | Proceedings of the Royal Society 21 (April 24) : 263-74 | |
| 1877 | 'Description of the process of verifying thermometers at the Kew Observatory.' | Philosophical Magazine 4 : 226-31 | |
| 1877 | 'Description of the process of verifying thermometers at the Kew Observatory.' | Proceedings of the Royal Society 26 (March 15) : 84-9 | |
| 1891 | 'Meteorological phenomena.' [Letter] | Nature 44 : 294 |
Galton also devised several novel and ingenious mechanical instruments for recording information about the weather, while working at the Kew Observatory. An example of the information recorded by such an instrument is reproduced below.
Galton describes the operation of this instrument as follows:
Part of our action was to maintain a few well-equipped self-recording Observatories--that is to say, where the instruments wrote down their own movements, photographically or otherwise. For instance, a sheet of photographic paper was moved slowly by clock-work in front of a barometer. The barometer stood in front of a slit in a screen, with a lamp on the other side. The light of the lamp passed freely through the empty portion of the glass tube on to the sensitive paper, but was shut off by the mercury. Hour lines were automatically marked upon the paper. The result was technically called a photographic "tracing," which showed at each moment of time how the barometer then stood. An analogous contrivance was' adapted to every one of the other instruments.
All the instrumental data were recorded by these tracings, but they were much too cumbrous in form and size for easy comparison. The question then arose whether it would not be possible to reduce these voluminous documents and print them in a compendious yearly volume. If so, the tracings would require very much more reduction in breadth than in height, for the photographic mark made by the recorder was so broad that the scale of the tracing had to be proportionately wide open; otherwise the neighbouring irregularities would blur together. A sharp line drawn along the middle of the tracings might, however, be much compressed laterally and yet show all the irregularities distinctly. I designed a compound drill pantagraph for the purpose, which reduced the tracings in height independently of the reduction in length. One part of the machine worked the drill forward and backwards, the other part moved the plate from side to side upon which it worked. The result was to express the tracings by fine grooves cut into a piece of soft metal. These were again reduced by an ordinary pantagraph. The whole process required thinking out in numerous details, but it proved quite a success. It is described in the annual Report of the Meteorological Office for 1869.
Squares of zinc, one for each day, were grooved by the drill pantagraph so as to show every one of the data without confusion. They referred to Wind Velocity and Direction, Barometric Height, Rainfall, Dry and Wet Thermometer, together with a line to show the amount of Humidity in the air, which was mechanically calculated from the combined traces of the two thermometers. These squares were placed beneath a large and beautifully designed German pantagraph, whose pointer was directed along the grooves in the zinc, while the diamond point of the scribe scratched the varnish on a copper plate, which was then etched by acid. The result was to produce quarto copper plates, each containing the whole of the instrumental data for each of the seven stations for five consecutive days. The original tracings are reduced to the ratio of 6: I in horizontal and 2: I in vertical measure. This work was steadily pursued for twelve years, which is long enough to include a complete cycle of solar sun-spots.