392 Life and Letters of Francis Galton
"It is now the part of those who have to fix the scales of marks to determine the weight to be given respectively to relative rank and to absolute performance in examinations of each different kind of service." (p. 32; B. A. R. p. 477.)
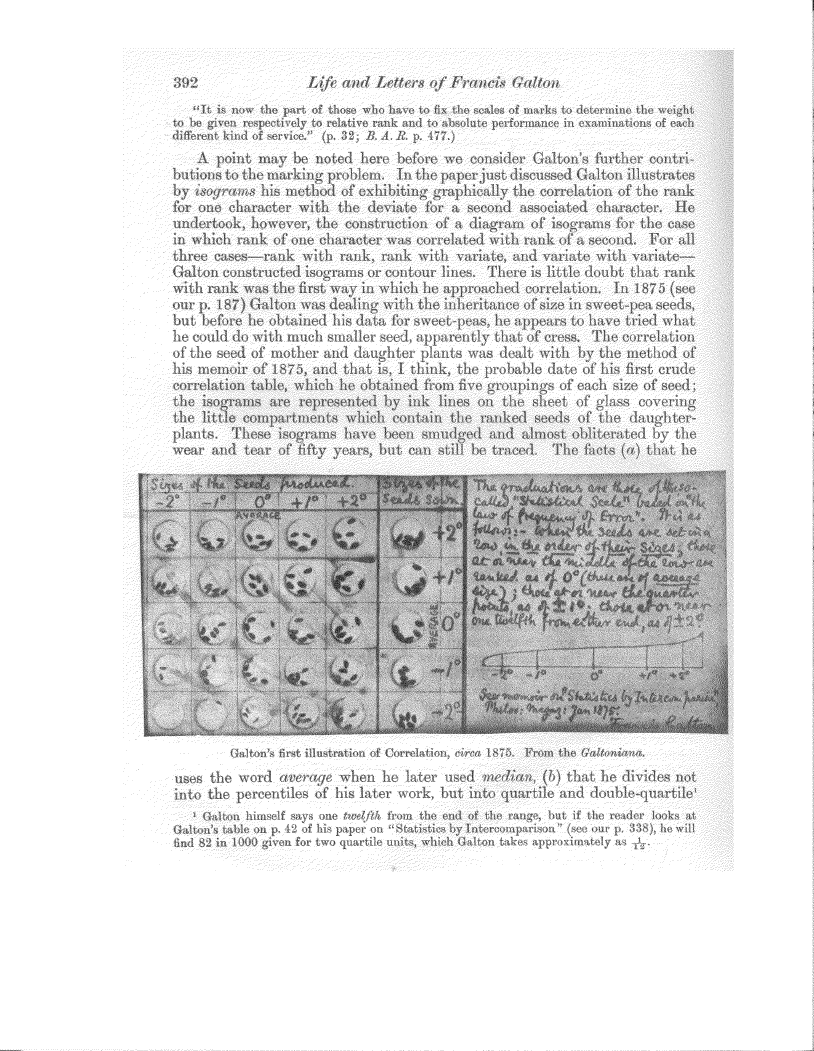
A point may be noted here before we consider Galton's further contributions to the marking problem. In the paper just discussed Galton illustrates by isograms his method of exhibiting graphically the correlation of the rank for one character with the deviate for a second associated character. He undertook, however, the construction of a diagram of isograms for the case in which rank of one character was correlated with rank of a second. For all three cases-rank with rank, rank with variate, and variate with variateGalton constructed isograms or contour lines. There is little doubt that rank with rank was the first way in which he approached correlation. In 1875 (see our p. 187) Galton was dealing with the inheritance of size in sweet-pea seeds, but before he obtained his data for sweet-peas, he appears to have tried what he could do with much smaller seed, apparently that of cress. The correlation of the seed of mother and daughter plants was dealt with by the method of his memoir of 1875, and that is, I think, the probable date of his first crude correlation table, which he obtained from five groupings of each size of seed; the isograms are represented by ink lines on the sheet of glass covering the little compartments which contain the ranked seeds of the daughterplants. These isograms have been smudged and almost obliterated by the wear and tear of fifty years, but can still be traced. The facts (a) that he
Galton's first illustration of Correlation, circa 1875. From the Galtoniana.
uses the word average when he later used median, (b) that he divides not into the percentiles of his later work, but into quartile and double-quartile'
1 Galton himself says one twelfth, from the end of the range, but if the reader looks at Galton's table on p. 42 of his paper on "Statistics by Intercomparison" (see our p. 338), he will find 82 in 1000 given for two quartile units, which Galton takes approximately as -Al
.