Statistical Investigations 391
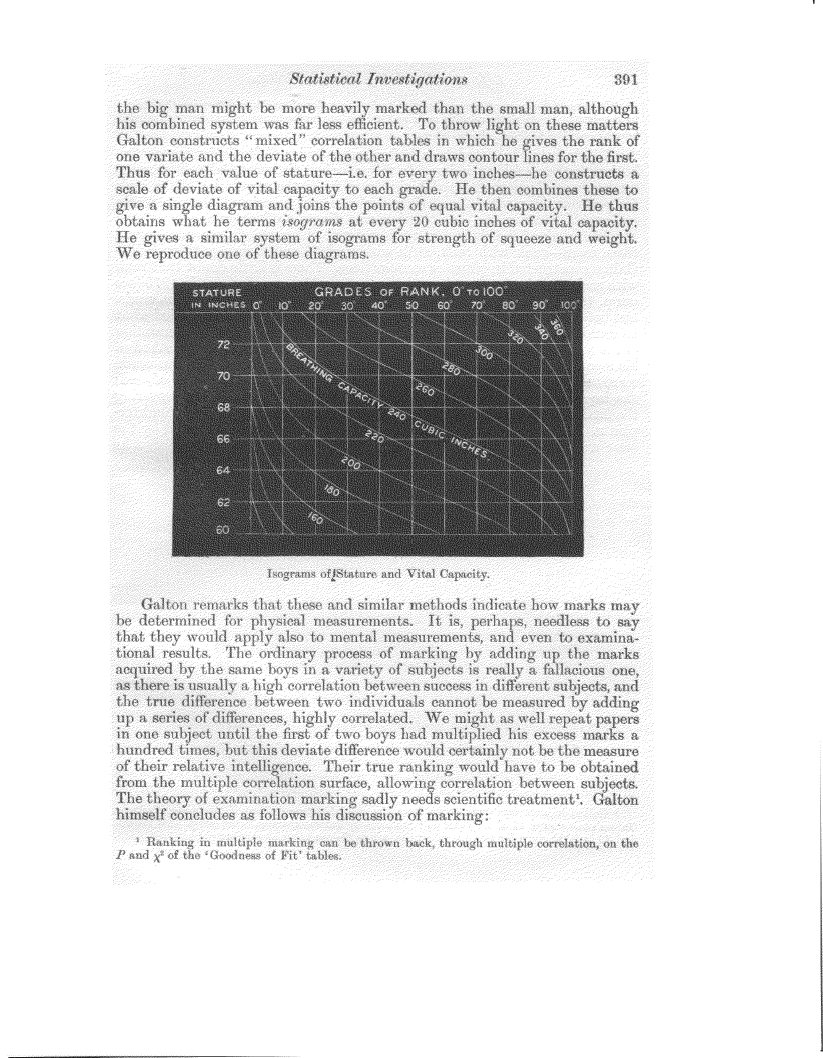
the big man might be more heavily marked than the small man, although his combined system was far less efficient. To throw light on these matters Galton constructs "mixed" correlation tables in which he gives the rank of one variate and the deviate of the other and draws contour lines for the first. Thus for each value of stature-i.e. for every two inches-he constructs a scale of deviate of vital capacity to each grade. He then combines these to give a single diagram and joins the points of equal vital capacity. He thus obtains what he terms isogrars at every 20 cubic inches of vital capacity. He gives a similar system of isograms for strength of squeeze and weight. We reproduce one of these diagrams.
Isograms ofIStature and Vital Capacity.
Galton remarks that these and similar methods indicate how marks may be determined for physical measurements. It is, perhaps, needless to say that they would apply also to mental measurements, and even to examinational results. The ordinary process of marking by adding up the marks acquired by the same boys in a variety of subjects is really a fallacious one, as there is usually a high correlation between success in different subjects, and the true difference between two individuals cannot be measured by adding up a series of differences, highly correlated. We might as well repeat papers in one subject until the first of two boys had multiplied his excess marks a hundred times, but this deviate difference would certainly not be the measure of their relative intelligence. Their true ranking would have to be obtained from the multiple correlation surface, allowing correlation between subjects. The theory of examination marking sadly needs scientific treatment'. Galton himself concludes as follows his discussion of marking:
Ranking in multiple marking can be thrown back, through multiple correlation, on the P and X2 of the `Goodness of Fit' tables.