OCR Rendition - approximate268 ItErowr-1883.
RE POIRT OF Till, AN'tI!li ll'O3n°ritIC COMIII'I'TP1;.
261),
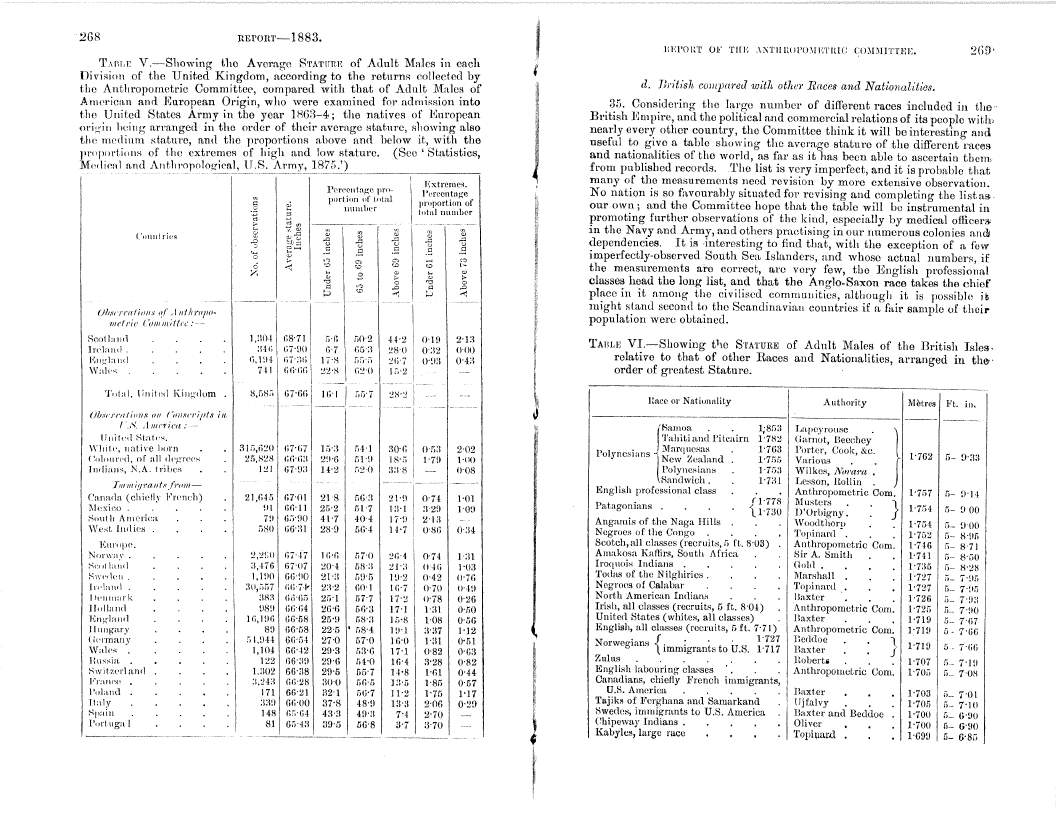
T,Atu,i: V.-Showing the Average S'r,'rmrl: of Adult Males in each Division of the United Kingdom, according to the returns collected by the Anthropometric Committee, compared with that of Adult Males of American and European Origin, who were examined for admission into the United States Army in the year 1863-4; the natives of European on 'in being arranged in the order of their average stature, showing also the tnediuni stature, and the proportions above and below it, with the proportions of the extremes of high and low stature. (See ` Statistics,
Medical and Anthropological, U.S. Army, 1875.')
-- - ---- ------------- - -
Percentage pro
portion of t,,tal
nuiuLcr
I?xtrernes. Percentage proportion of
(ohil number
a'S .0
P 0 v
O n
G 0
i
OLx rrotioil.e nJ ,I urtlrw po 1,:1(11 68'71 a 502
5.6
netrie t.hMw;1tre: -
Scotland
lrcl:uail . 1146 67.90 6-7 65-3
I~~nhl:tu~l 6,194 67'36 17.8 55'5
\Vales 711 66'1;,; 22'8 62-0
Total, I;ailed Kingdom 8, 58.5 67'(16 161 1,6'7
Ob''rrewlion.s ou ('ou,ee°ripts in 31 5,620 67`67 ],-)-:1 54.1
V.S. :1 1au1 i ra
I eiliil State'.
White, native born
('olonrcd, or all da grecs 25,828 66-63 29-6 5P')
Indians N.A. Iribra 121 67-93 14.2 52 0
Immigrants trwm 21,645 6701 21 8 66' 3
Canada (chiefly French)
Mexico . 91 66.11 25-2 51-7
Snnlb America 79 6:6' 90 41-7 40.4
West lath's 581) 66':11 28-9 56,4
Europe. 2,2!; 0 67'•17 166 57-0
Niorsvav .
Sw~tl:~~nl 9,-176 67-07 201 58:1
;wedeli . 1,191) 66-90 21.13 59.5
Ir •l;uul . :111,557 66.74' 232 60.1
I tetnu:u'3: 389 65-65 25'1 57-7
Ilollaud 989 66'64 26.6 56.3
h;nrl;uul 15,196 66.58 25-9 58-3
I l ungary 89 66-58 22-5 ' 68.4
Germany . 51,944 66'.54 27-0 57-0
Walks 1,1(14 66.12 29.3 53.1
Ihisia 122 66':11) 29.6 54.0
Switzerland 1.302 66-38 29.5 55.7
i"r;utce . 3,2413 66-28 30-0 56.5
Poland 171 66,21 32-1 56.7
Italy :1:311 66.00 37.8 48'1.1
SIsaill 148 65.64 43'3 49'3
Port up 1 81 65'4:1 89.5 56-8
a
Ca
a Co
a
a
L] P
0
a
d. British compared with other Races and Nationalities.
35. Considering the large number of different races included in the,, British Empire, and the political and commercial relations of its people withr, nearly every other country, the Committee think it will be interesting and useful to give a table showing the average stature of the different races and nationalities of the world, as far as it has been able to ascertain them from published records. The list is very imperfect, and it is probable that many of the measurements need revision by more extensive observation. No nation is so favourably situated for revising and completing the list asour own; and the Committee hope that the table will be instrumental in promoting further observations of the kind, especially by medical officer. in the Navy and Army, and others practising in our numerous colonies and dependencies. It is -interesting to find that, with the exception of a few imperfectly-observed South Sea Islanders, and whose actual numbers, if the measurements are correct, are very few, the English professional classes head the long list, and that the Anglo-Saxon race takes the chief place in it among the civilised communities, although it is possible it might stand second to the Scandinavian countries if a fair sample of their
412 0-19 2.1:3 population were obtained.
28.0 I 0':32 000 TABLE VI-Showing the STATURE of Adult Males of the British Isles,
26.7 0-93 0.4:3 relative to that of other Races and Nationalities, arranged in the r.
152 of greatest Stature.
28.2
Pace or Nationality Authority Metres Ft. in,
30-6 0.5:1 2'O2 Polynesians JMarquesas Samoa 1;85:5 Lapeyrouse \ 1.762 5- 9.33
IS S 1.79 1.00 3 Tahiti and Pitcairn 1-782 Barnot, lleechey
1.763 Porter, Cook, &e.
New Zealand . 1.755 Various
:1:1 8 Polynesians 1.753 Wilkes, 1Virrera ,
l
0.08 Sandwich . 1.731 L ..
cs_son ltol1rn
English professional class Anthropometric Com. 1.757 5- 9.14
21.9 0'74 1.01 1"1 .778 Musters
13.1 :1.29 1-09 Patagonians D'Orbigny. 1.754 5- 900
1-730
17-9 2.13 Anganils of the Naga hills _ W'oodthoro 1.761 5- 9'00
14.7 0'8(i 034 Negroes of the Congo Topinard 1.762 5- 8.95
Scotch, all classes (recruits,5 ft. 8-03) Anthropometric Com. 1.746 5- 8'71
21.4 0'7.1 1 31 Amakosa Kaflirs, South Africa Sir A. Smith P741 ti- 8'50
21-:1 0 ,16 1.0:3 Iroquois Indians Gold . 1.7:35 5- 8-28
19-2 0.42 076 'Podas of the Nilghiries . Marshall 1.727 5- 7'95
16'7 0'70 0.4!) Negroes of Calabar Topinard 1.727 5- 7-95
17-2 0-78 0'26 North American Indians Baxter 1.72(1 5- 7.9:3
17-1 1'31 0.50 Irish, all classes (recruits, 5 ft. 8-04) Anthropometric Corn. 1.725 5- 7-90
15.8 1.08 0.56 United States (whites, all classes) Baxter 7.719 5- 7-67
'191 :3.37 1.12 English, all classes (recruits, 5 ft. 7'71) Anthropometric Corn. 1719 5 - 7'66
:11 r 1-727 Beddoe 3,
16'0 1 0.51 Norwegians Baxter f 1'719 5- 7'66,
17-1 0.82 06:3 1 immigrants to U.S. 1'717
16-4 3.28 0.82 Zulus . Itobertc . 1-707 5_ 7-19
14.8 1-61 0,44 English labouring classes Anthropometric Cum, 1.705 5- 708
13.5 1-85 0-57 Canadians, chiefly French immigrants,
11-2 1.75 1.17 U.S. America . Baxter 1.703 5_. 7-01
13-3 2-06 029 Tajiks of Ferghana and Samarkand llj fal vy 1.705 5- 7' 10
7.4 2-70 Swedes, immigrants to U.S. America Baxter and Beddoc 1.700 5- (3'90
3.7 3'70 Chipeway Indians . , Oliver 1.700 5.- G-90
Kabyles, large race Topigard 1.699 5- 6.85
|