| ||||||
OCR Rendition - approximate
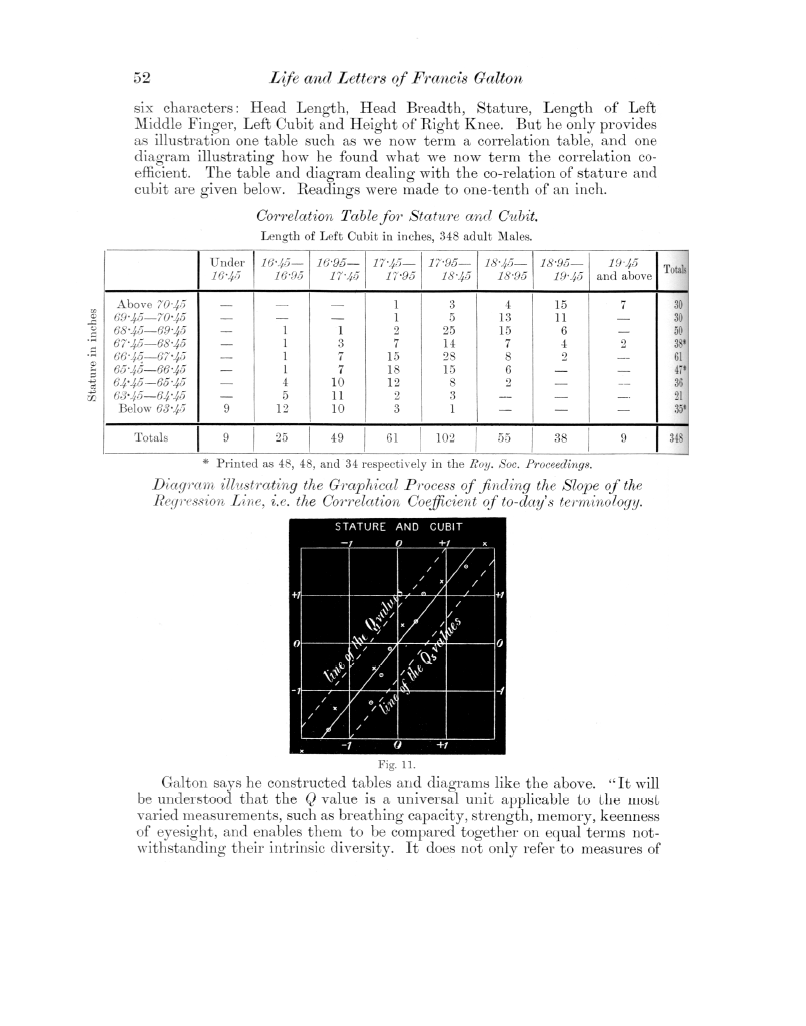
52 Life and Letters of Francis Galton six characters : Head Length, Head Breadth, Stature, Length of Left Middle Finger, Left Cubit and Height of Right Knee. But he only provides as illustration one table such as we now term a correlation table, and one diagram illustrating how he found what we now term the correlation coefficient. The table and diagram dealing with the co-relation of stature and cubit are given below. Readings were made to one-tenth of an inch. Correlation Table for Stature and Cubit. Length of Left Cubit in inches, 348 adult dales.
* Printed as 48, 48, and 34 respectively in the Roy. Soc. Proceedings. Diagrma n illustrating the Graphical Process of nding the Slope of the Regression Line, i.e. the Correlation Coefficient of to-day's terminology.  Fig. ii. Galton says he constructed tables and diagrams like the above. "It will be understood that the Q value is a universal unit applicable to the most varied measurements, such as breathing capacity, strength, memory, keenness of eyesight, and enables them to be compared together on equal terms notwithstanding their intrinsic diversity. It does not only refer to measures of
| ||||||||||||||||||||||||||||||||||||||||||||||||||||||||||||||||||||||||||||||||||||||||||||||||||||||||||||||||||||