TABLE 8.
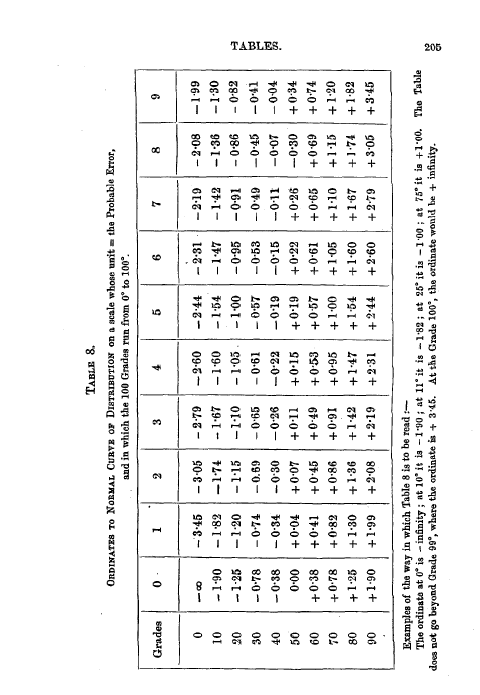
ORDINATES TO NORMAL CURVE OF DISTRIBUTION on a scale whose unit = the Probable Error,
and in which the 100 Grades run from 0° to 100'.
|
Grades |
0 |
1 |
2 |
3 |
4 |
5 |
6 |
7 |
8 |
9 |
|
0 |
-m |
-3.45 |
-3.05 |
-2.79 |
-2.60 |
-2.44 |
-2-31 |
-2.19 |
-2.08 |
-1.99 |
|
10 |
-1-90 |
-1.82 |
-1.74 |
-1.67 |
-1.60 |
-1-54 |
-1.47 |
-1.42 |
-1.36 |
-1,30 |
|
20 |
-1.25 |
-1-20 |
-1.15 |
-1.10 |
-1.05. |
-1.00 |
-0-95 |
-0-91 |
-0-86 |
-0-82 |
|
30 |
-0-78 |
-0.74 |
-0.69 |
-0-65 |
-0.61 |
-0.57 |
-0.53 |
-0-49 |
-0.45 |
-0.41 |
|
40 |
-0.38 |
-0.34 |
-0.30 |
-0-26 |
-0.22 |
-0'19 |
-0-15 |
-0.11 |
-0.07 |
-0.04 |
|
50 |
0.00 |
+0.04 |
+0-07 |
+0.11 |
+0'15 |
+0.19 |
+0-22 |
+0.26 |
-0.30 |
+0.34 |
|
60 |
+0-38 |
+0-41 |
+0.45 |
+0-49 |
+0.53 |
+0.57 |
+0-61 |
+0-65 |
+0-69 |
+0-74 |
|
70 |
+0-78 |
+0-82 |
+0-86 |
+0.91 |
+0-95 |
+1-00 |
+1-05 |
+1.10 |
+1.15 |
+1.20 |
|
80 |
+1-25 |
+1-30 |
+1-36 |
+1- 42 |
+1-47 |
+1-54 |
+1-60 |
+1-67 |
+1-74 |
+1-82 |
|
90 |
+1-90 |
+1-99 |
+2.08 |
+2-19 |
+2.31 |
+2'44 |
+2.60 |
+2.79 |
+3.05 |
+3-45 |
Examples of the way in which Table 8 is to be read :
The ordinate at 0° is -infinity; at 10° it is -1'90 ; at 11° it is -1'82 ; at 25° it is -1'00 ; at 75° it is +1'00. The Table does not go beyond Grade 99°, where the ordinate is + 3'45. At the Grade 100', the ordinate would be + infinity.