202 NATURAL INHERITANCE.
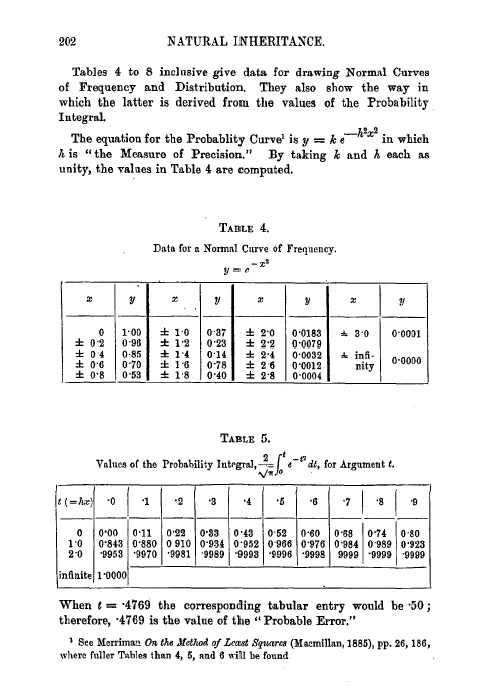
Tables 4 to 8 inclusive give data for drawing Normal Curves of Frequency and Distribution. They also show the way in which the latter is derived from the values of the Probability Integral.
The equation for the Probablity Curve' is y = k e-h2x2 in which h is "the Measure of Precision." By taking k and h each as unity, the values in Table 4 are computed.
TABLE 4.
Data for a Normal Curve of Frequency. -,2 J=e
|
x |
y |
x |
|
x |
y |
x |
y |
|
0 |
1.00 |
f 1.0 |
0.37 |
f 2.0 |
0.0183 |
4- 3.0 |
0.0001 |
|
f 0.2 |
0.96 |
± 1.2 |
0.23 |
± 2.2 |
0.0079 |
|
|
|
f 04 |
0-85 |
f 1.4 |
0-14 |
f 2.4 |
0.0032 |
t infi- |
0.0000 |
|
f 0.6 |
0.70 |
± 1.6 |
0.78 |
± 2.6 |
0.0012 |
nity |
|
|
f 0.8 |
0.53 |
f 1.8 |
0.40 |
± 2.8 |
0.0004 |
|
|
TABLE 5.
t
Values of the Probability lutegral, e-t2dt, for Argument t.
aJo
|
t (=hx) |
0 |
1 |
2 |
3 |
4 |
5 |
6 |
7 |
8 |
9 |
|
0 |
0'00 |
0.11 |
0.22 |
0.33 |
0.43 |
0-52 |
0.60 |
0.68 |
0.74 |
0-80 |
|
1.0 |
0.843 |
0.880 |
0 910 |
0.934 |
0.952 |
0'966 |
0.976 |
0.984 |
0.989 |
0.923 |
|
2.0 |
9953 |
9970 |
9981 |
-9989 |
9993 |
9996 |
9998 |
9999 |
'9999 |
9999 |
|
infinite |
1.0000 |
|
When t = •4769 the corresponding tabular entry would be '50 ; therefore, •4769 is the value of the "Probable Error."
I See Merriman On the Method of Least Squares (Macmillan, 1885), pp. 26,186, where fuller Tables than 4, 5, and 6 will be found