| ||||||
OCR Rendition - approximate
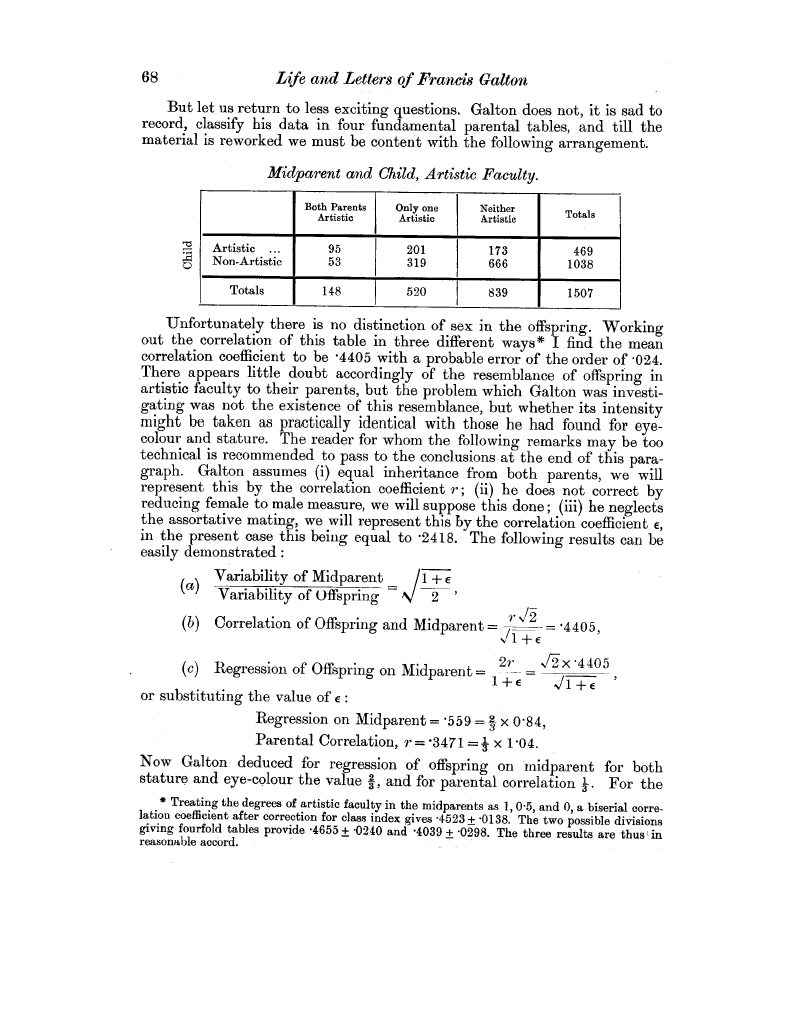
68 Life and Letters of Francis Galton But let us return to less exciting questions. Galton does not, it is sad to record, classify his data in four fundamental parental tables, and till the material is reworked we must be content with the following arrangement. U Midparent and Child, Artistic Faculty.
Unfortunately there is no distinction of sex in the offspring. Working out the correlation of this table in three different ways* I find the mean correlation coefficient to be •4405 with a probable error of the order of •024. There appears little doubt accordingly of the resemblance of offspring in artistic faculty to their parents, but the problem which Galton was investigating was not the existence of this resemblance, but whether its intensity might be taken as practically identical with those he had found for eyecolour and stature. The reader for whom the following remarks may be too technical is recommended to pass to the conclusions at the end of this paragraph. Galton assumes (i) equal inheritance from both parents, we will represent this by the correlation coefficient r ; (ii) he does not correct by reducing female to male measure, we will suppose this done; (iii) he neglects the assortative mating, we will represent this by the correlation coefficient E, in the present case this being equal to '2418. The following results can be easily demonstrated
or substituting the value of c: Regression on Midparent = '559 = 3 x 0 Parental Correlation, r = '3471= . x 1.04. Now Galton deduced for regression of offspring on Mdparent for both stature and eye-colour the value 3, and for parental correlation 3. For the Treating the degrees of artistic faculty in the midparents as 1, 0.5, and 0, a biserial correlation coefficient after correction for class index gives •4523±'0138. The two possible divisions giving fourfold tables provide •4655 ± •0240 and '4039 ± '0298. The three results are thus._ in reasonable accord.
| |||||||||||||||||||||||||||||||||||||||||||||||||||||