| ||||||
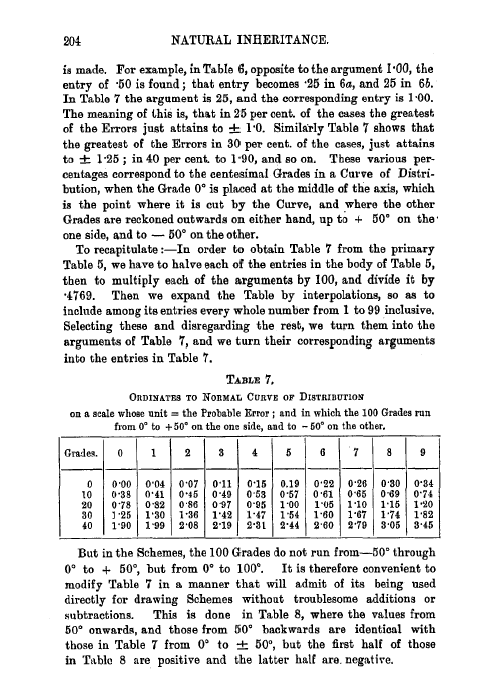
OCR Rendition - approximate204 NATURAL INHERITANCE. is made. For example, in Table 6, opposite to the argument I'00, the entry of '50 is found ; that entry becomes '25 in 6a, and 25 in 6b. In Table 7 the argument is 25, and the corresponding entry is 1.00. The meaning of this is, that in 25 per cent. of the cases the greatest of the Errors just attains to ± 1'0. Similarly Table 7 shows that the greatest of the Errors in 30 per cent. of the cases, just attains to ± 1.25 ; in 40 per cent. to 1.90, and so on. These various percentages correspond to the centesimal Grades in a Curve of Distribution, when the Grade 0° is placed at the middle of the axis, which is the point where it is cut by the Curve, and where the other Grades are reckoned outwards on either hand, up to + 50° on the, one side, and to - 50° on the other. To recapitulate :-In order to obtain Table 7 from the primary Table 5, we have to halve each of the entries in the body of Table 5, then to multiply each of the arguments by 100, and divide it by '4769. Then we expand the Table by interpolations, so as to include among its entries every whole number from 1 to 99 inclusive. Selecting these and disregarding the rest, we turn them into the arguments of Table 7, and we turn their corresponding arguments into the entries in Table 7. TABLE 7. ORDINATES TO NORMAL CURVE OF DISTRIBUTION on a scale whose unit = the Probable Error ; and in which the 100 Grades run
But in the Schemes, the 100 Grades do not run from-50° through 0° to + 50°, but from 0° to 100°. It is therefore convenient to modify Table 7 in a manner that will admit of its being used directly for drawing Schemes without troublesome additions or subtractions. This is done in Table 8, where the values from 50° onwards, and those from 50° backwards are identical with those in Table 7 from 0° to ± 50°, but the first half of those in Table 8 are positive and the latter half are. negative. |