By FRANCIS GALTON, F.R.S.
Received December 5, 1888.
[Proceedings of the Royal Society of London 45 (1888), 135-145.]
``Co-relation or correlation of structure'' is a phrase much used in biology, and not least in that branch of it which refers to heredity, and the idea is even more frequently present than the phrase; but 1 am not aware of any previous attempt to define it clearly, to trace its mode of action in detail, or to show how to measure its degree.
Two variable organs are said to be co-related when the variation of the one is accompanied on the average by more or less variation of the other, and in the same direction. Thus the length of the arm is said to be correlated with that of the leg, because a person with a long arm has usually a long log, and conversely. If the correlation be close, then a person with a very long arm would usually have a very long leg; if it be moderately close, then the length of the leg would usually be only long, not very long; and if there were no correlation at all then the length of the leg would on the average be mediocre. It is easy to see that correlation must be the consequence of the variations of the two organs being partly due to common causes. If they were wholly due to common causes, the correlation would be perfect, as is approximately the case with the symmetrically disposed parts of the body. If they were in no respect due to common causes, the co-relation would be nil. Between these two extremes are an number of intermediate cases, and it will be shown how the closeness of correlation in any particular case admits of being expressed by a simple number.
To avoid the possibility of misconception, it is well to point out that the subject in hand has nothing whatever to do with the average proportions between the various limbs, in different races, which have been often discussed from early times up to the present day, both by artists and by anthropologists. The fact that the average ratio between the stature and the cubit is as 100 to 37, or thereabouts, does not give the slightest information about the nearness with which they vary together. It would be an altogether erroneous inference to suppose their average proportion to be maintained so that when the cubit might be expected to be one-twentieth longer than the average cubit, the stature might be expected to be one-twentieth greater than the average stature, and conversely. Such a supposition is easily shown to be contradicted both by fact and theory.
The relation between the cubit and the stature will be shown to be such that for every inch, centimetre, or other unit of absolute length that the cubit deviates from the mean length of cubits, cubits, the stature will on the average deviate from the mean length of statures to the amount of 2.5 units, and in the same direction. Conversely, for each unit of deviation of stature, the average deviation of the cubit will he 0.26 unit. These relations are not numerically reciprocal, but the exactness of the co-relation becomes established when we have transmuted the inches or other measurement of the cubit and of the stature into units dependent on their respective scales of variability. We thus cause a long cubit and an equally long stature, as compared to the general run of cubits and statures, to be designated by an identical scale-value. The particular unit that I shall employ is the value of the probable error of any single measure in its own group. In that of the cubit, the probable error is 0.56 inch = 1.42 cm.; in the stature it is 1.75 inch = 4.44 cm. Therefore the measured lengths of the cubit in inches will be transmuted into terms of a new scale in which each unit = 0.56 inch, and the measured lengths of the stature will be transmuted into terms of another new scale in which each unit is 1.75 inch. After this has been done, we shall find the deviation of the cubit as compared to the mean of the corresponding deviations of the stature, to be as 1 to 0.8. Conversely, the deviation of the stature as compared to the mean of the corresponding deviations of the cubit will also be as l to 0.8. Thus the existence of the co-relation is established, and its measure is found to be 0.8.
Now as to the evidence of all this. The data were obtained at my anthropometric laboratory at South Kensington. They are of males of 21 years and upwards, but as a large proportion of them were students, and barely 21 years of age, they were not wholly full-grown; but neither that fact nor the small number of observations is prejudicial to the conclusions that will be reached. They were measured in various ways, partly for the purpose of this inquiry. It will be sufficient to give some of them as examples. The exact number of 350 is not preserved throughout, as injury to some limb or other reduced the available number by 1, 2, or 3 in different cases. After marshalling the measures of each limb in the order of their magnitudes, I noted the measures in each series that occupied the positions of the first, second and third quarterly divisions. Calling these measures in any one series Q1, M and Q3, I take M, which is the median or middlemost value, as that whence the deviations are to be measured, and [ 1/2]{Q3-Q3}=Q as the probable error of any single measure in the series. This is practically the same as saying that one-half of the deviations fall within the distance of ±Q from the mean value, because the series run with fair symmetry. In this way I obtained the following values of M and Q, in which the second decimal must be taken as only roughly approximate. The M and Q of any particular series may be identified by a suffix, thus Mc, Qc might stand for those of the cubit, and Mi, Qi for those of the stature.
| M | Q | |||
| Inch. | Cubit. | Inch. | Cubit. | |
| Head length | 7.62 | 19.35 | 0.19 | 0.48 |
| Head breadth | 6.00 | 15.24 | 0.18 | 0.46 |
| Stature | 67.20 | 170.69 | 1.75 | 4.44 |
| Left middle finger | 4.54 | 11.53 | 0.15 | 0.38 |
| Left cubit | 18.05 | 45.70 | 0.56 | 1.42 |
| Height of right knee | 20.50 | 52.00 | 0.80 | 2.03 |
NOTE.-The head length is its maximum length measured from the notch between and just below the eyebrows. The cubit is measured from the hand prone and without taking off the coat; it is the distance between the elbow of the bent left arm and the tip of the middle finger. The height of the knee is taken sitting when the knee is bent at right angles, less the measured thickness of the heel of the boot.
Tables were then constructed, each referring to a different pair the above elements, like Tables II and III, which will suffice as examples of the whole of them. It will be understood that the Q value is a universal unit applicable to the most varied measurements, such as breathing capacity, strength, memory, keenness of eyesight, and enables them to be compared together on equal terms notwithstanding their intrinsic diversity. It does not only refer to measures of length, though partly for the sake of compactness, it is only those of length that will be here given as examples. It is unnecessary to extend the limits of Table II, as it includes every line and column in my MS table that contains not less than twenty entries. None of the entries lying within the flanking lines and columns of Table II were used.
| Length of left cubit in inches, 348 adult males. | |||||||||
| Stature in | 16.5 | 17.0 | 17.5 | 18.0 | 18.5 | 19.0 | Total | ||
| inches. | Under | and | and | and | and | and | and | 19.5 | cases. |
| 16.5 | under | under | under | under | under | under | and | ||
| 17.0 | 17.5 | 18.0 | 18.5 | 19.0 | 19.5 | above | |||
| 71 and above | .. | .. | .. | 1 | 3 | 4 | 15 | 7 | 30 |
| 70 | .. | .. | .. | 1 | 5 | 13 | 11 | .. | 30 |
| 69 | .. | 1 | 1 | 2 | 25 | 15 | 6 | .. | 50 |
| 68 | .. | 1 | 3 | 7 | 14 | 7 | 4 | 2 | 48 |
| 67 | .. | 1 | 7 | 15 | 28 | 8 | 2 | .. | 61 |
| 66 | .. | 1 | 7 | 18 | 15 | 6 | .. | .. | 48 |
| 65 | .. | 4 | 10 | 12 | 8 | 2 | .. | .. | 36 |
| 64 | .. | 5 | 11 | 2 | 3 | .. | .. | .. | 21 |
| Below 64 | 9 | 12 | 10 | 3 | 1 | .. | .. | .. | 34 |
| Totals | 9 | 25 | 49 | 61 | 102 | 55 | 38 | 9 | 348 |
The measures were made and recorded to the nearest tenth of an inch. The heading of 70 inches of stature includes all records between 69.5 and 70.4 inches; that of 69 includes all between 68.5 and 69.4, and so on.
Stature Ms = 67.2 inches; Qs = 1.75 inch. Left Cubit Mc = 18.05 inches; Qc = 0.56 inch.
|
No. of Cases |
Stature. |
Deviation from Ms reckoned in |
Mean of Corresponding left cubits. |
Deviation from Ms reckoned in |
Smoothed Values Multiplied by Qc. |
Added to Mc. |
|||
|
Inches. |
Units of Qc. |
||||||||
|
Inches. |
Units of Q,. |
Observed. |
Smoothed. |
||||||
|
inches. |
|
|
inches. |
||||||
|
30 |
70.0 |
+2.8 |
+1.60 |
18.8 |
+0.8 |
+1.42 |
+1.30 |
+0.73 |
18.8 |
|
50 |
69.0 |
+1.8 |
+1.03 |
18.3 |
+0.3 |
+0.53 |
+0.84 |
+0.47 |
18.5 |
|
38 |
68.0 |
+0.8 |
+0.46 |
18.2 |
+0.2 |
+0.36 |
+0.38 |
+0.21 |
18.3 |
|
61 |
67.0 |
-0.2 |
-0.11 |
18.1 |
+0.1 |
+0.18 |
-0.08 |
-0.04 |
18.0 |
|
48 |
66.0 |
-1.2 |
-0.69 |
17.8 |
-0.2 |
-0.36 |
-0.54 |
-0.30 |
17.8 |
|
36 |
65.0 |
-2.2 |
-1.25 |
17.7 |
-0.3 |
-0.53 |
-1.00 |
-0.56 |
17.5 |
|
21 |
64.0 |
-3.2 |
-1.83 |
17.2 |
-0.8 |
-1.46 |
-1.46 |
-0.80 |
17.2 |
|
No. of cases. |
Left cubit. |
Deviation from Mc reckoned in |
Mean of corresponding statures. |
Deviation from Ms, reckoned in |
Smoothed values Multiplied by Qs. |
Added to Ms |
|||
|
Inches |
Units of Qs. |
||||||||
|
Inches. |
Units of Qc. |
Observed. |
Smoothed. |
||||||
|
inches. |
|
|
inches. |
||||||
|
38 |
19.25 |
+1.20 |
+2.14 |
70.3 |
+3.1 |
+1 8 |
+1.70 |
+3.0 |
70.2 |
|
55 |
18 75 |
+0.70 |
+1.25 |
68.7 |
+1.5 |
+0.9 |
+1.00 |
+1.8 |
69.0 |
|
102 |
18.25 |
+0.20 |
+0.36 |
67.4 |
+0.8 |
+0.1 |
+0.28 |
+0.5 |
67.7 |
|
61 |
17.75 |
-0.30 |
-0.53 |
86.3 |
-0.9 |
-0.5 |
-0.43 |
-0.8 |
66.4 |
|
98 |
17.25 |
-0.80 |
-1.43 |
66.0 |
-2.2 |
-1.3 |
-1.15 |
-2.0 |
65.2 |
|
26 |
18.75 |
-1.30 |
-2.31 |
63.7 |
-3.S |
-2.0 |
-1.85 |
-3.2 |
64.0 |
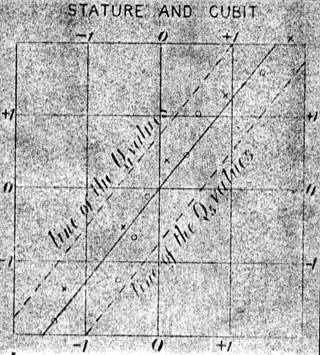
The values derived from Table II, and from other similar tables, are entered in Table III, where they occupy all the columns up to the three last, the first of which is headed ``smoothed.'' These smoothed values were obtained by plotting the observed values, after transmuting them as above described into their respective Q units, upon a diagram such as is shown in the figure. The deviations of the ``subject'' are measured parallel to the axis of y in the figure, and those of the mean of the corresponding values of the ``relative'' are measured parallel to the axis of x. When the stature is taken as the subject, the median positions of the corresponding cubits, which are given in the successive lines of Table III, are marked with small circles. When the cubit is the subject, the mean positions of the corresponding statures are marked with crosses. The firm line in the figure is drawn to represent the general run of the small circles and crosses. It is here seen to be a straight line, and it was similarly found to be straight in every other figure drawn from the different pairs of co-related variables that I have as yet tried. But the inclination of the line to the vertical differs considerably in different cases. In the present one the inclination is such that a deviation of 1 on the part of the subject, whether it be stature or cubit, is accompanied by a mean deviation on the part of the relative, whether it be cubit or stature, of 0.8. This decimal fraction is consequently the measure of the closeness of the correlation. We easily retransmute it into inches. If the stature be taken as the subject, then Qs is associated with Qc×0.8; that is, a deviation of 1.75 inches in the one with 0.56 ×0.8 of the other. This is the same as 1 inch of stature being associated with a mean length of cubit equal to 0.26 inch. Conversely, if the cubit he taken as the subject, then Qc is associated with Qs×0.8; that is, a deviation of 0.56 inch in the one with 1.75×0.8 of the other. This is the same as 1 inch of cubit being associated with a mean length of 2.5 inches of stature. If centimetre be read for inch the same holds true. Six other tables are now given in a summary form, to show how well calculation on the above principle agrees with observation.
| Mean of corresponding | Mean of corresponding | ||||||
| No. | Length | statures. | No. | lengths of head. | |||
| of | of | of | Height | ||||
| cases. | head. | cases. | |||||
| Observed. | Calculated. | Observed. | Calculated. | ||||
| 32 | 7.90 | 68.5 | 68.1 | 26 | 70.5 | 7.72 | 7.75 |
| 41 | 7.80 | 67.2 | 67.8 | 30 | 69.5 | 7.70 | 7.72 |
| 46 | 7.70 | 67.6 | 67.5 | 50 | 68.5 | 7.65 | 7.68 |
| 52 | 7.60 | 66.7 | 67.2 | 49 | 67.5 | 7.65 | 7.64 |
| 58 | 7.50 | 66.8 | 66.8 | 56 | 66.5 | 7.57 | 7.60 |
| 34 | 7.40 | 66.0 | 66.5 | 43 | 65.5 | 7.57 | 7.69 |
| 26 | 7.30 | 66.7 | 66.2 | 31 | 64.5 | 7.54 | 7.65 |
| Mean of corresponding | Length | Mean of corresponding | |||||
| No. | lengths of left | No. | of left | statures. | |||
| of | Height. | middle finger. | of | middle | |||
| cases. | cases. | finger. | |||||
| Observed. | Calculated. | Observed. | Calculated. | ||||
| 30 | 70.5 | 4.71 | 4.74 | 23 | 4.80 | 70.2 | 69.4 |
| 50 | 69.5 | 4.55 | 4.68 | 49 | 4.70 | 68.1 | 68.5 |
| 37 | 68.5 | 4.57 | 4.62 | 62 | 4.60 | 68.0 | 67.7 |
| 62 | 67.5 | 4.58 | 4.56 | 63 | 4.50 | 67.3 | 66.9 |
| 48 | 66.5 | 4.59 | 4.50 | 57 | 4.40 | 66.0 | 66.1 |
| 37 | 65.5 | 4.47 | 4.44 | 35 | 4.30 | 65.7 | 65.3 |
| 20 | 64.5 | 4.33 | 4.38 | ||||
| Mean of corresponding | Mean of corresponding | ||||||
| No. | Left | lengths of left cubit. | No. | Length | lengths of left middle | ||
| of | middle | of | of left | finger. | |||
| cases. | finger. | cases. | cubit. | ||||
| Observed. | Calculated. | Observed. | Calculated. | ||||
| 23 | 4.80 | 18.97 | 18.80 | 29 | 19.00 | 4.76 | 4.75 |
| 50 | 4.70 | 18.55 | 18.49 | 32 | 18.70 | 4.64 | 4.69 |
| 62 | 4.60 | 18.24 | 18.18 | 48 | 18.40 | 4.60 | 4.62 |
| 62 | 4.50 | 18.00 | 17.87 | 70 | 18.10 | 4.56 | 4.55 |
| 57 | 4.40 | 17.72 | 17.55 | 37 | 17.80 | 4.49 | 4.48 |
| 34 | 4.30 | 17.27 | 17.24 | 31 | 17.50 | 4.40 | 4.41 |
| 28 | 17.20 | 4.37 | 4.34 | ||||
| 24 | 16.90 | 4.32 | 4.28 | ||||
| Mean of corresponding | Mean of corresponding | ||||||
| No. | Length | breadths of head. | No. | Breadth | lengths of head. | ||
| of | of | of | of | ||||
| cases. | head. | cases. | head. | ||||
| Observed. | Calculated. | Observed. | Calculated. | ||||
| 32 | 7.90 | 6.14 | 6.12 | 27 | 6.30 | 7.72 | 7.84 |
| 41 | 7.80 | 6.05 | 6.08 | 36 | 6.20 | 7.72 | 7.75 |
| 46 | 7.70 | 6.14 | 6.04 | 53 | 6.10 | 7.65 | 7.65 |
| 52 | 7.60 | 5.98 | 6.00 | 58 | 6.00 | 7.68 | 7.60 |
| 34 | 7.40 | 5.96 | 5.91 | 37 | 5.80 | 7.55 | 7.50 |
| 26 | 7.30 | 5.85 | 5.87 | 30 | 5.70 | 7.45 | 7.46 |
| Mean of corresponding | Mean of corresponding | ||||||
| No. | heights of knee. | No. | Height | statures. | |||
| of | Stature. | of | of | ||||
| cases. | cases. | knee. | |||||
| Observed. | Calculated. | Observed. | Calculated. | ||||
| 30 | 70.0 | 21.7 | 21.7 | 23 | 22.2 | 70.5 | 70.6 |
| 50 | 69.0 | 21.1 | 21.3 | 32 | 21.7 | 69.8 | 69.6 |
| 38 | 68.0 | 20.7 | 20.9 | 50 | 21.2 | 68.7 | 68.6 |
| 61 | 67.0 | 20.5 | 20.5 | 68 | 20.7 | 67.3 | 67.7 |
| 49 | 66.0 | 20.2 | 20.1 | 74 | 20.2 | 66.2 | 66.7 |
| 36 | 65.0 | 19.7 | 19.7 | 41 | 19.7 | 65.5 | 65.7 |
| 26 | 19.2 | 64.3 | 64.7 | ||||
| Mean of corresponding | Mean of corresponding | ||||||
| No. | heights of knee. | No. | Height | left cubit. | |||
| of | Left | of | of | ||||
| cases. | cubit. | cases. | knee. | ||||
| Observed. | Calculated. | Observed. | Calculated. | ||||
| 29 | 19.0 | 21.5 | 21.6 | 23 | 22.25 | 18.98 | 18.97 |
| 32 | 18.7 | 21.4 | 21.2 | 30 | 21.75 | 18.68 | 18.70 |
| 48 | 18.4 | 20.8 | 20.9 | 52 | 21.25 | 18.38 | 18.44 |
| 70 | 17.1 | 20.7 | 20.6 | 69 | 20.75 | 18.15 | 18.17 |
| 37 | 17.8 | 20.4 | 20.2 | 70 | 20.25 | 17.75 | 17.90 |
| 31 | 17.5 | 20.0 | 19.9 | 41 | 19.75 | 17.55 | 17.63 |
| 28 | 17.2 | 19.8 | 19.6 | 27 | 19.25 | 17.02 | 17.36 |
| 23 | 16.9 | 19.3 | 19.2 | ||||
Table V.
| ||||||||||||||||||||||||||||||||||||||||||||||||||||||||||||||||||||||||||||||||||||||||||||||||||||||||||||||||||||||||||||||||||||||||||||||||
The rationale of all this will be found discussed in the paper on ``Hereditary Stature,'' to which reference has already been made, and in the appendix to it by Mr. J. D. Hamilton Dickson. The entries in any table, such as Table II, may be looked upon as the values of the vertical ordinates to a surface of frequency, whose mathematical properties were discussed in the above-mentioned appendix, therefore I need not repeat them here. But there is always room for legitimate doubt whether conclusions based on the strict properties of the ideal law of error would be sufficiently correct to be serviceable in actual cases of correlation between variables that conform only approximately to that law. It is therefore exceedingly desirable to put the theoretical conclusions to frequent test, as has been done with these anthropometric data. The result is that anthropologists may now have much less hesitation than before, in availing themselves of the properties of the law of frequency of error.
I have given in Table V a column headed Ö{(1-r2)}=f. The meaning of f is explained in the paper on ``Hereditary Stature.'' It is the Q value of the distribution of any system of x values, as x1, x2, x3, &c., round the mean of all of them, which we may call X. The knowledge of f enables dotted lines to be drawn, as in the figure above, parallel to the line of M values, between which one half of the x observations, for each value of y, will be included. This value of f has much anthropological interest of its own, especially in connexion with M. Bertillon's system of anthropometric identification, to which I will not call attention now.
It is not necessary to extend the list of examples to show how to measure the degree in which one variable may be correlated with the combined effect of n other variables, whether these be themselves correlated or not. To do so, we begin by reducing each measure into others, each having the Q of its own system for a unit. We thus obtain a set of values that can be treated exactly in the same way as the measures of a single variable were treated in Tables II and onwards. Neither is it necessary to give examples of a method by which the degree may be measured, in which the variables in a series each member of which is the summed effect of n variables, may be modified by their partial correlation. After transmuting the separate measures as above, and then summing them, we should find the probable error of any one of them to be Ön if the variables were perfectly independent, and n if they were rigidly and perfectly co-related. The observed value would be almost always somewhere intermediate between these extremes, and would give that information that is wanted.
To conclude, the prominent characteristics of any two correlated variables, so far at least as I have as yet tested them, are four in number. It is supposed that their respective measures have been first transmuted into others of which the unit is in each case equal to the probable error of a since single measure in its own series. Let y=the deviation of the subject, whichever of the two variables may be taken in that capacity; and let x1, x2, x3, &c., be the corresponding deviations of the relative, and let the mean of these be X. Then we find: (1) that y=rX for all values of y; (2) that r is the same, whichever of the two variables is taken for the subject; (3) that r is always less than 1; (4) that r measures the closeness of correlation.