| ||||||
OCR Rendition - approximate
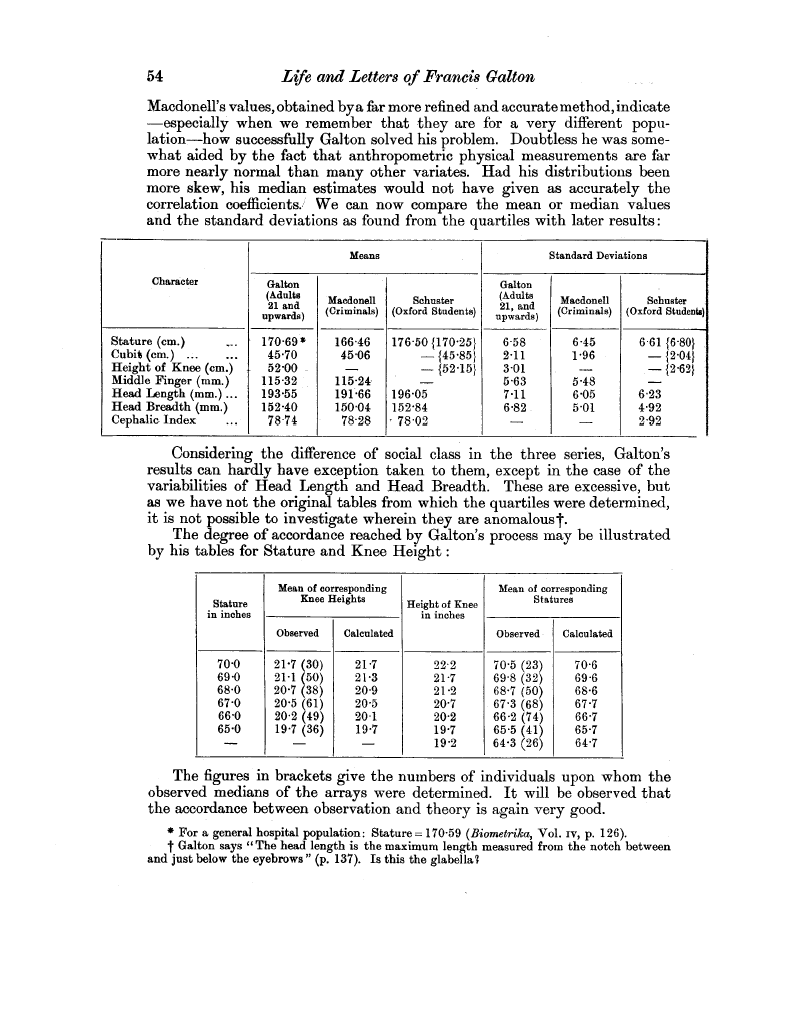
54 Life and Letters of Francis Galton Macdonell's values, obtained by a far more refined and accurate method, indicate -especially when we remember that they are for a very different population-how successfully Galton solved his problem. Doubtless he was somewhat aided by the fact that anthropometric physical measurements are far more nearly normal than many other variates. Had his distributions been more skew, his median estimates would not have given as accurately the correlation coefficients.,,; We can now compare the mean or median values and the standard deviations as found from the quartiles with later results
Considering the difference of social class in the three series, Galton's results can hardly have exception taken to them, except in the case of the variabilities of Head Length and Head Breadth. These are excessive, but as we have not the original tables from which the quartiles were determined, it is not possible to investigate wherein they are anomalous-. The degree of accordance reached by Galton's process may be illustrated by his tables for Stature and Knee Height
The figures in brackets give the numbers of individuals upon whom the observed medians of the arrays were determined. It will be observed that the accordance between observation and theory is again very good. * For a general hospital population: Stature= 170-59 (Biometrika, Vol. iv, p. 126). t Galton says °1 The head length is the maximum length measured from the notch between and just below the eyebrows" (p. 137). Is this the glabella7
| ||||||||||||||||||||||||||||||||||||||||||||||||||||||||||||||||||||||||||||||||||||||||||||||||||||||||||||||||||||||||