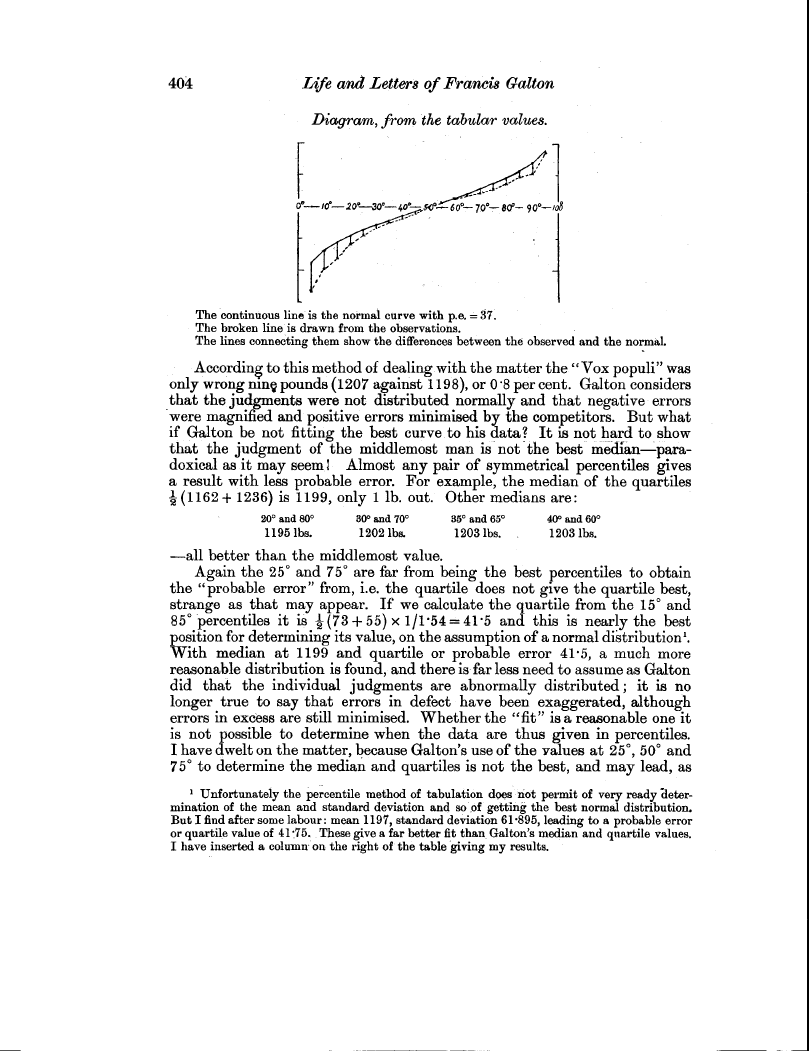
404 Life and Letters of Francis Galton Diagram, from the tabular values.
0°----i0-20..30'-4n=-W--60 70°-8d'- 90°-108
The continuous line is the normal curve with p.e. = 37.
The broken line is drawn from the observations.
The lines connecting them show the differences between the observed and the normal.
According to this method of dealing with the matter the " Vox populi" was only wrong nine pounds (1207 against 1198), or 0.8 percent. Galton considers ,that the judgments were not distributed normally and that negative errors were magnified and positive errors minimised by the competitors. But what if Galton be not fitting the best curve to his data? It is not hard to show that the judgment of the middlemost man is not the best median-paradoxical as it may seem i Almost any pair of symmetrical percentiles gives a result with less probable error. For example, the median of the quartiles 1(1162 + 1236) is 1199, only 1 lb. out. Other medians are:
20° and 80° 300 and 70° 35° and 65° 40° and 60°
1195 lbs. 1202 lbs. 1203 lbs. 1203 lbs.
-all better than the middlemost value.
Again the 25° and 75° are far from being the best percentiles to obtain the "probable error" from, i.e. the quartile does not give the quartile best, strange as that may appear. If we calculate the quartile from the 15' and
85° percentiles it is 2 (73 + 55) x 11.54 = 41.5 and this is nearly the best
position for determining its value, on the assumption of a normal distribution'. With median at 1199 and quartile or probable error 41.5, a much more reasonable distribution is found, and there is far less need to assume as Galton did that the individual judgments are abnormally distributed ; it is no longer true to say that errors in defect have been exaggerated, although errors in excess are still minimised. Whether the "fit" is a reasonable one it is not possible to determine when the data are thus given in percentiles. I have dwelt on the matter, because Galton's use of the values at 25°, 50° and 75° to determine the median and quartiles is not the best, and may lead, as
' Unfortunately the percentile method of tabulation does not permit of very ready determination of the mean and standard deviation and so of getting the best normal distribution. But I find after some labour: mean 1197, standard deviation 61.895, leading to a probable error or quartile value of 41:75. These give a far better fit than Galton's median and quartile values. I have inserted a column on the right of the table giving my results.