Statistical Investigations 399
for measurement'. One of these papers deals with heredity and will be considered in the following chapter. The first of the remaining three belongs to Galton's work on composite photography. It is entitled : "Conventional Representation of the Horse in Motion." In this paper Galton endeavours to construct the conventional attitude of sculpture or of painting from composites of Muybridge's photographs of the Horse in Motion." The final result ought to represent a mule, for it is certainly a very hybrid structure.
"The first composite shows the hind legs distinctly, the second shows the forelegs distinctly; and if duplicates of the first and second woodcuts are each divided into two halves and the best defined halves of each are united (in a way that might have occurred to Baron Munchausen if a second rider's horse had suffered as his own, and there had been a mistake in piecing them) a result is produced that shows a very fair correspondence with a not uncommon representation
in sculpture."
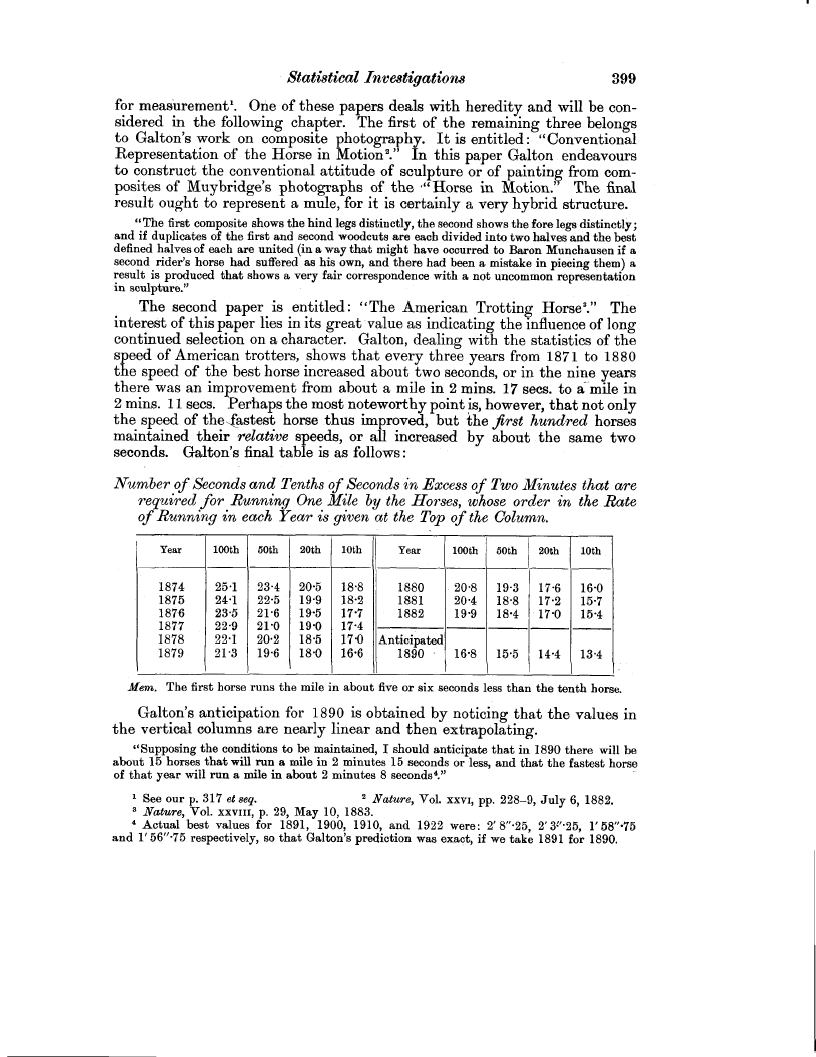
The second paper is entitled : "The American Trotting Horse." The interest of this paper lies in its great value as indicating the influence of long continued selection on a character. Galton, dealing with the statistics of the speed of American trotters, shows that every three years from 1871 to 1880 the speed of the best horse increased about two seconds, or in the nine years there was an improvement from about a mile in 2 mins. 17 sets. to a --mile in 2 mins. 11 sees. Perhaps the most noteworthy point is, however, that not only the speed of thefiastest horse thus improved, but the first hundred horses maintained their relative speeds, or all increased by about the same two seconds. Galton's final table is as follows
Number of Seconds and Tenths of Seconds in Excess of Two Minutes that are required for Running One Mile by the Horses, whose order in the Rate of Running in each Year is given at the Top of the Column.
|
Year |
100th |
50th |
20th |
10th |
Year |
100th |
50th |
20th |
10th |
|
1874 |
25.1 |
23.4 |
20.5 |
18.8 |
1880 |
20.8 |
19.3 |
17.6 |
16.0 |
|
1875 |
24.1 |
22.5 |
19.9 |
18.2 |
1881 |
20.4 |
18.8 |
17.2 |
15.7 |
|
1876 |
23.5 |
21.6 |
19.5 |
17.7 |
1882 |
19.9 |
18.4 |
17.0 |
15.4 |
|
1877 |
22.9 |
21.0 |
19.0 |
17.4 |
|
|
|
|
|
|
1878 |
22.1 |
20.2 |
18.5 |
17.0 |
Anticipated |
|
|
|
|
|
1879 |
21.3 |
19.6 |
18.0 |
16.6 |
1890 - |
16.8 |
15.5 |
14.4 |
13.4 |
Hem. The first horse runs the mile in about five or six seconds less than the tenth horse.
Galton's anticipation for 1890 is obtained by noticing that the values in the vertical columns are nearly linear and then extrapolating.
"Supposing the conditions to be maintained, I should anticipate that in 1890 there will be about 15 horses that will run a mile in 2 minutes 15 seconds or less, and that the fastest horse of that year will run a mile in about 2 minutes 8 seconds°."
1 See our p. 317 et seq. 2 Nature, Vol. xxvi, pp. 228-9, July 6, 1882. 3 Nature, Vol. xxviii, p. 29, May 10, 1883.
4 Actual best values for 1891, 1900, 1910, and 1922 were: 2'8"-25, T3'-25, 1'58"-75 and 1'56"-75 respectively, so that Galton's prediction was exact, if we take 1891 for 1890.